Maps
The izeltlabuak.hu website primarily focuses on arthropods found in Hungary. This entry also deals with Hungarian fauna.
Overview
On various pages of the website, we show the location of one observation or multiple observations on a map. We also show the distribution of species on maps.
Availability
Map view is available on the following pages:
Map Views
When arriving at observation pages, we see the distribution on the map as a static image. Observation points are marked with a drop. A larger drop indicates a greater number of recorded observations in that area.
With the icon visible in the top left corner of the map, we can switch to dynamic view. In this view, we can use the map's zoom in/out function, move the map, and change between grouped or individual display of observation points.
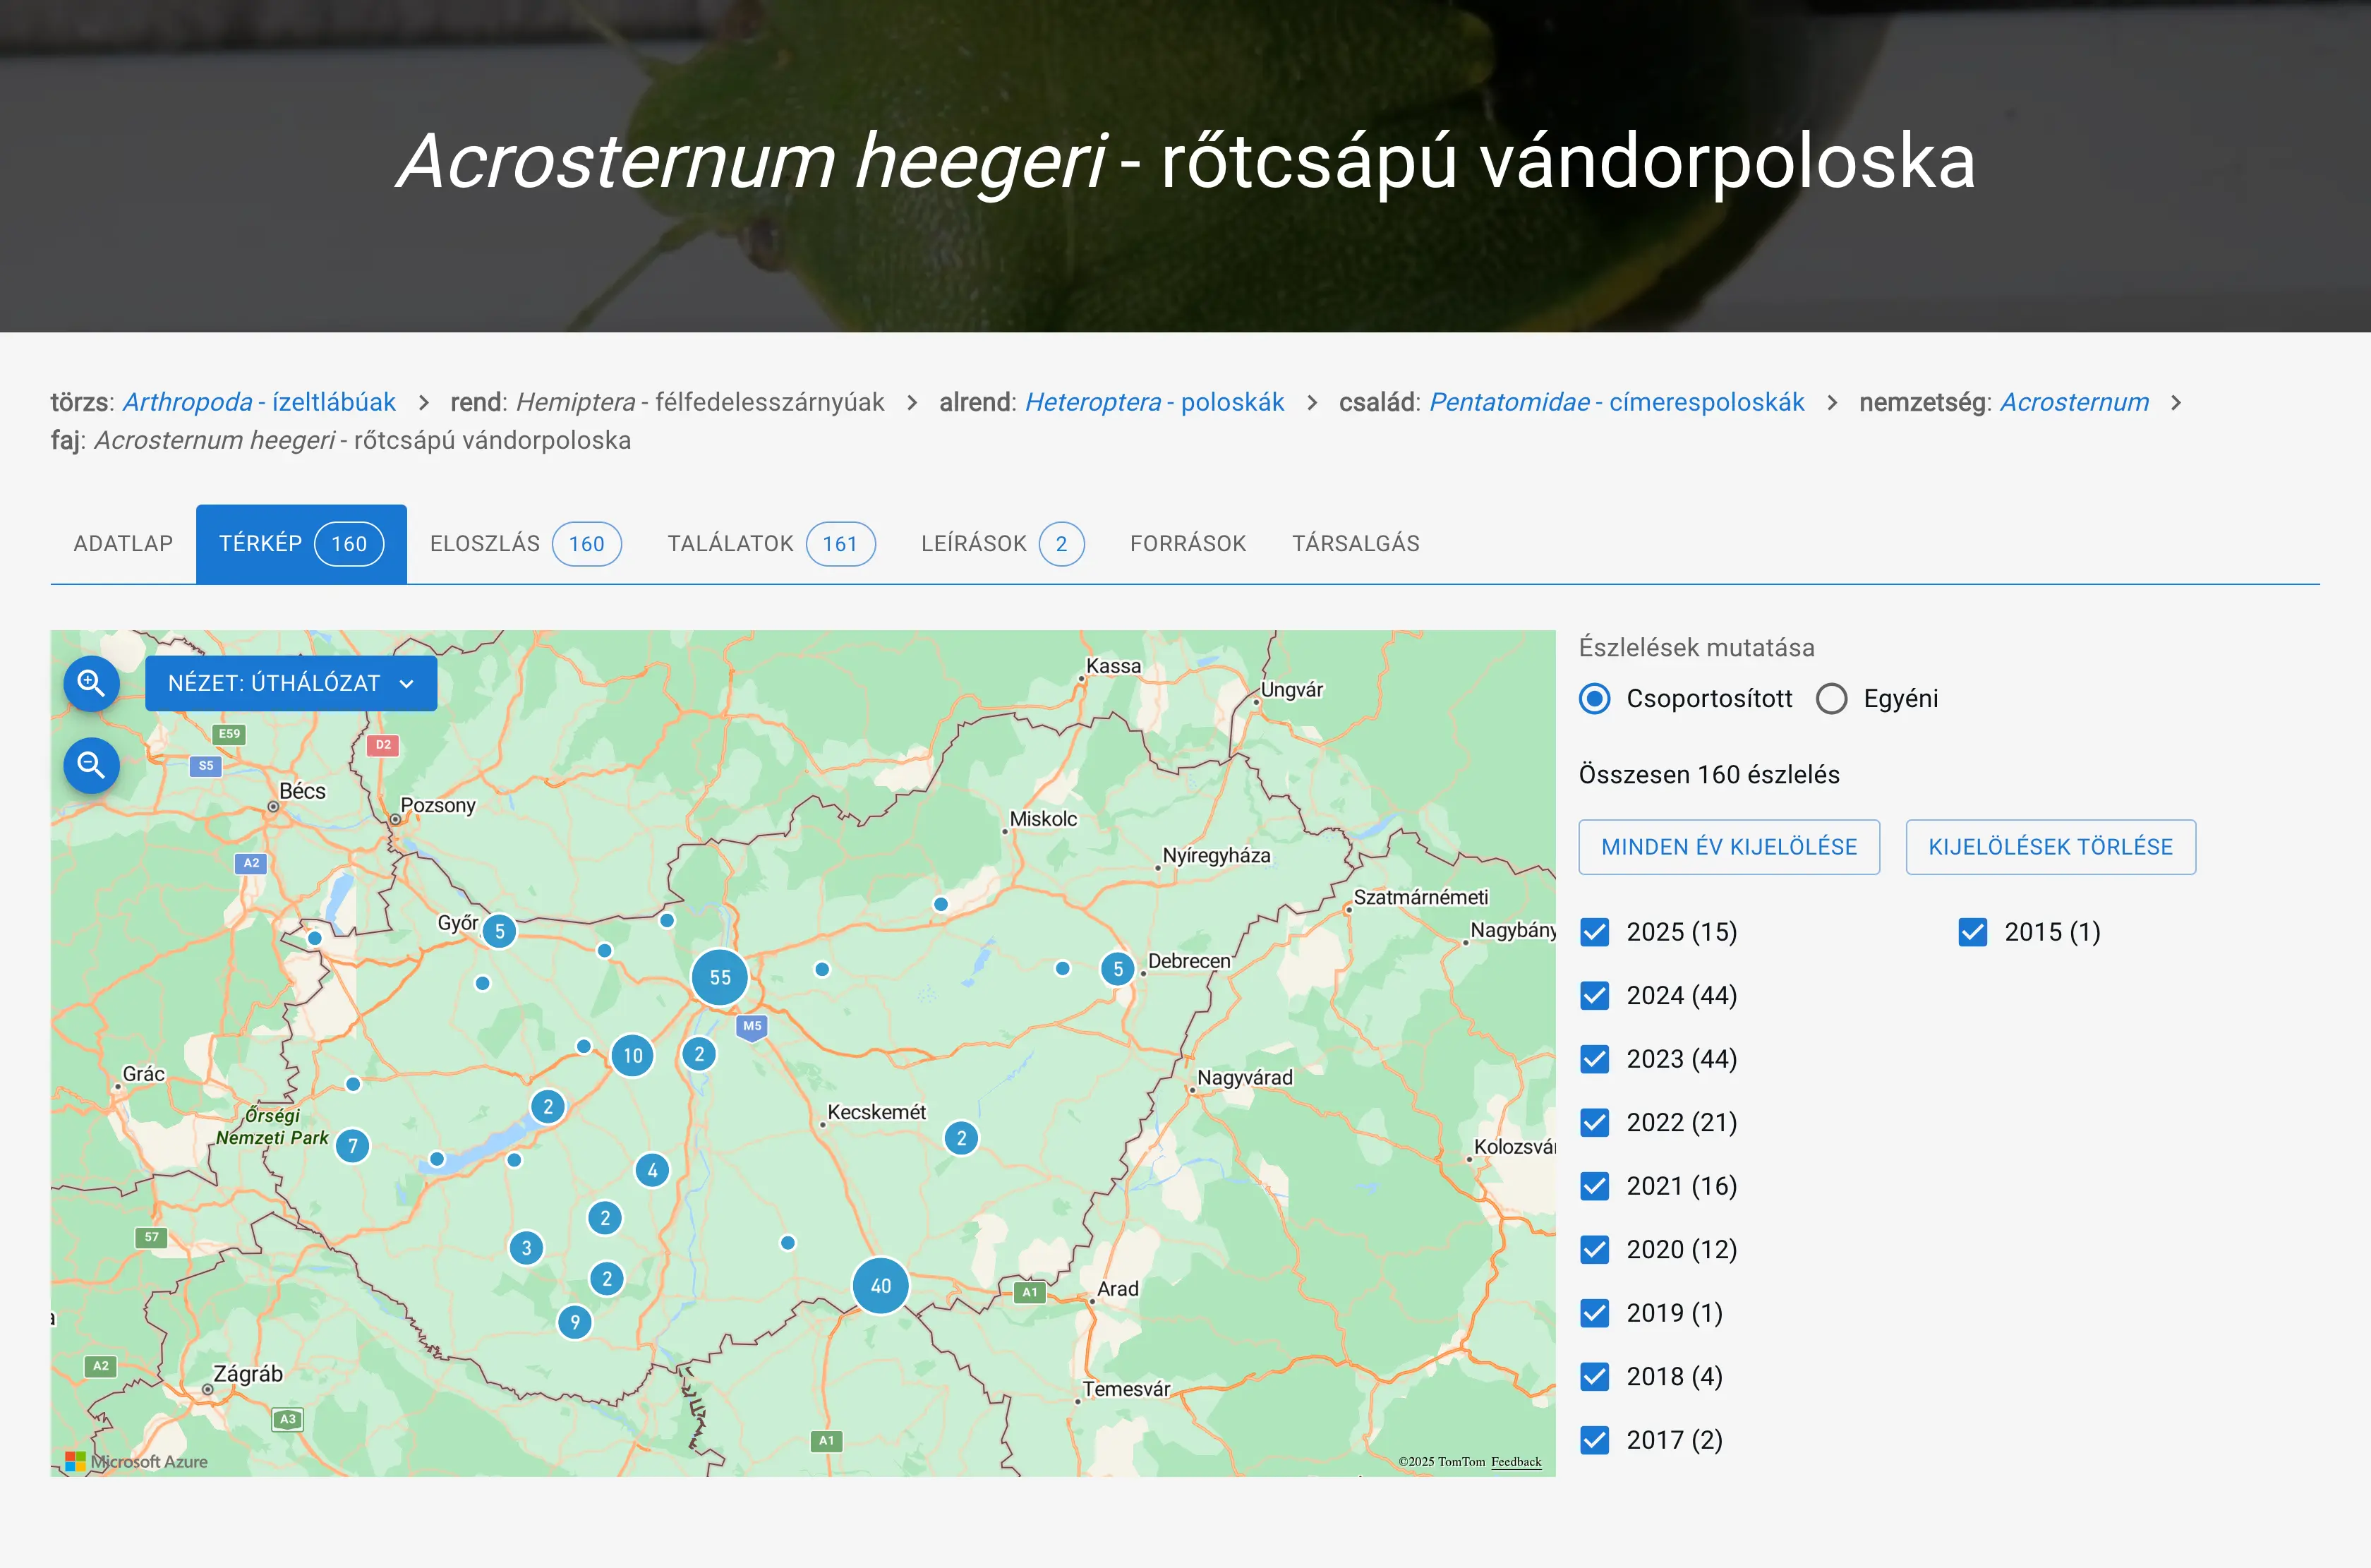 Acrosternum heegeri - red-antennae wandering bug distribution map
Grouped and Individual Display of Observation Points
On observation pages where we show multiple observations, to the right of the map we can change the grouped or individual display of observation points. When changing between grouped or individual display of observations, or when changing yearly display, the map automatically switches to dynamic state.
In grouped display, observation points are marked with a circle containing a number showing the number of observations.
In individual display, observation points are shown separately with a circle, without numbers. Each circle represents one observation.
The display change is persistent, so if we once choose grouping, from then on observation points will always appear grouped on the map. If individual, then always in individual form.
Yearly Changes in Observations
On the right side of the map, we can see the list of years of observations. By selecting the appropriate year from the list, the map automatically displays observations belonging to that year.
Detailed Display of Observations
In dynamic view, by clicking on the circles marking observations, the observations appear below the map with images and detailed data.
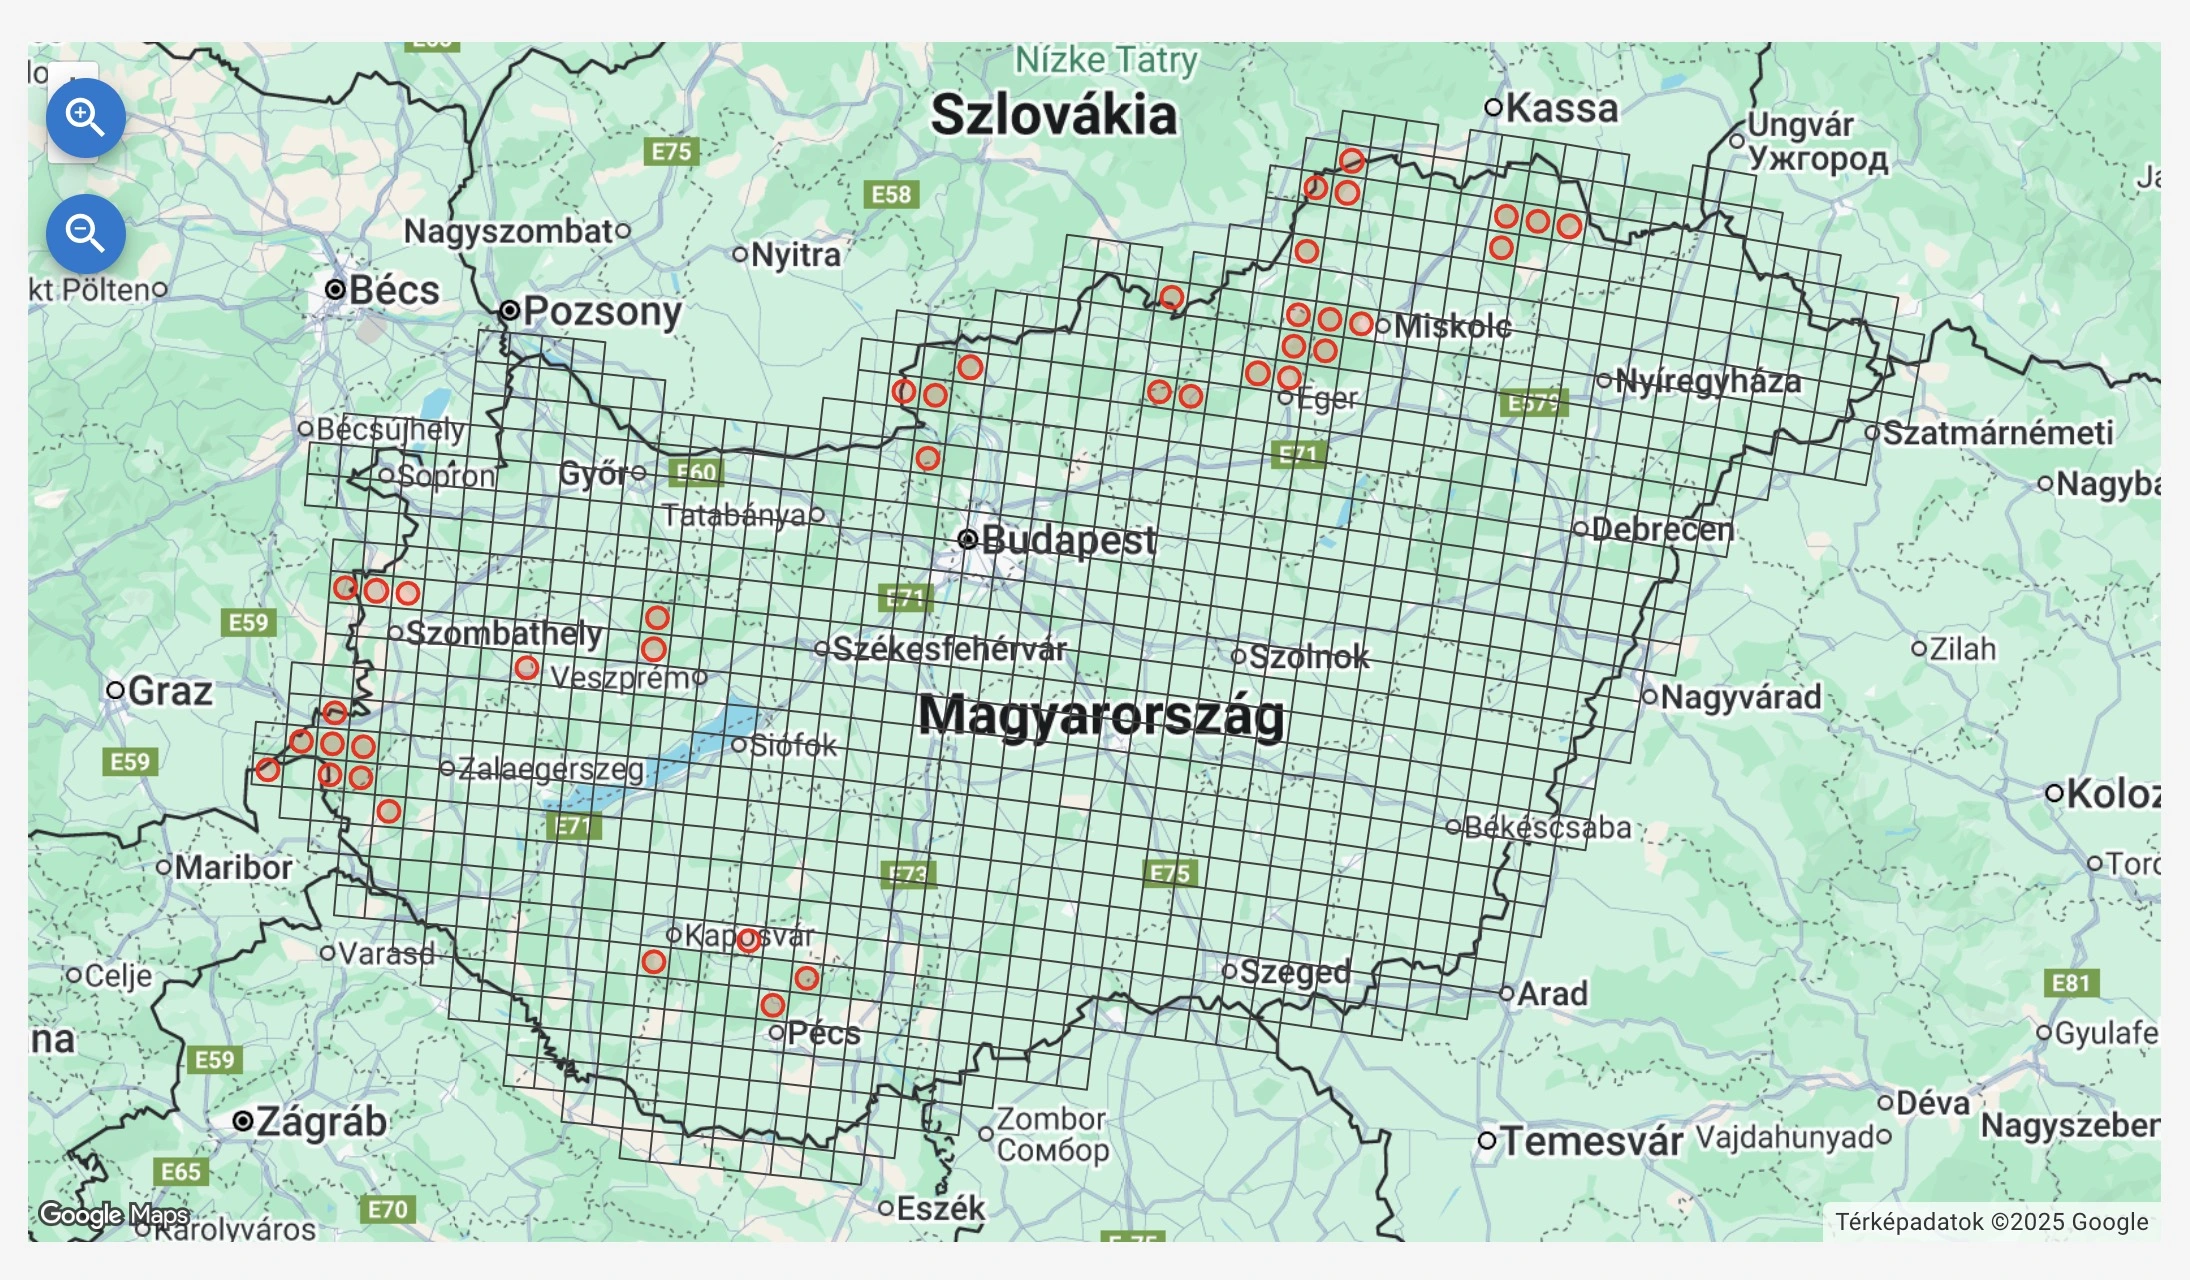
Grid
For protected species, for species protection, observations on the map are shown with ETC_BD or UTM grid. On the profile settings other settings page we can choose between the two grids.
For these species, foreign observations are not visible on the map.
For a user's observations or on the observations page, we only show precise coordinates to the owner.
On a species' observations map display, by clicking on the points, we can see the observations belonging there in detail below the map.
Example: Apatura iris - purple emperor observations on ETC/BD grid map
Map Layers
In dynamic view, in the top left corner of the map, we can change the following layers:
- Road network
- Satellite
- Tourist
Layer changes are persistent, so if we once select one, from then on we will always get that layer.
Layer Providers
Map layers are supported by Microsoft and Google. Their support makes it possible to display distributions on maps.
On map pages, we can get layers from either of the two providers.
Observation Recording
When recording observations, the map is equipped with additional functions that help with location specification.